Intent to Insights: Why Your Data Stack Needs a Conversational Brain
"The goal is to turn data into information, and information into insight." — Carly Fiorina, former CEO of HP
Reading time: 12 minutes Series: The Matih Platform Blog Series (1 of 8) Audience: CTOs, VPs of Data, Business Leaders, Anyone drowning in dashboards

The Ticket That Changed Everything
It's 9:47 AM on a Tuesday. Sarah, VP of Operations at a mid-market retail company, has a simple question: "Which product categories had the highest stockout rate last quarter, broken down by region?"
She knows the answer lives somewhere in her company's data. She's paying for seven different tools to manage that data. She has a team of twelve people whose entire job is working with data.
And yet, to get this answer, she opens Jira. She files a ticket. She marks it "high priority" (they all are). She waits.
Three days later, David from the data engineering team picks it up. He needs to build a pipeline to join the inventory table with the regional dimensions table. He spends half a day figuring out which Airflow DAG to modify, discovers the schema changed last week when someone updated the warehouse connector, and pings the BI team to ask why the column names don't match the documentation.
Five days after Sarah's question, she gets a Tableau link. The chart is slightly wrong — it shows revenue instead of stockout rate. She replies to the ticket. David fixes it. Seven days total.
By then, the regional managers have already made their restocking decisions based on gut feeling. The moment of decision expired before the data arrived.
This isn't a failure of people. It's a failure of architecture.
The Dirty Secret of the Modern Data Stack
Here's what nobody in the data industry wants to admit: we've built an incredible collection of best-of-breed tools — and then left it to every organization on the planet to figure out how to wire them together.
The average enterprise data team juggles 8 to 15 different tools. Ingestion tools. Transformation tools. Orchestration tools. Query engines. BI platforms. ML frameworks. Data catalogs. Monitoring dashboards. Each one brilliant in isolation. Together? A Frankenstein's monster held together with YAML files and prayer.
The integration tax is real. Industry surveys consistently show that data teams spend 40-60% of their time on plumbing — connecting tools, managing credentials, debugging cross-system failures, onboarding new team members on yet another interface — instead of actually generating insights.
Let that sink in. Your most expensive technical hires are spending more than half their time being expensive plumbers.
"We are drowning in information but starved for knowledge." — John Naisbitt
Five Problems Hiding in Plain Sight
The Sarah story isn't unique. It plays out thousands of times daily across every industry. And when you trace it back to root causes, you find five systemic problems that no individual tool can solve.
1. Tool Sprawl: The Integration Tax
Every tool in your stack has its own authentication model, its own configuration format, its own API, its own failure modes, and its own upgrade cycle. Connecting Tool A to Tool B requires custom glue code. When Tool A upgrades and breaks the integration, your data engineer becomes a full-time debugger.
The cost isn't just license fees. It's the hidden multiplier: 50,000-100,000 in onboarding costs per new hire who needs to learn a dozen different interfaces.
2. The Skills Gap: The Human Bottleneck
The people who have the questions (executives, analysts, product managers) are rarely the people who can answer them (data engineers, SQL wizards, ML engineers). This creates an asymmetry where a small number of specialists serve a large number of stakeholders, and every request goes through a queue.
Self-service BI tools were supposed to fix this. They didn't. They just moved the bottleneck from "write SQL" to "learn our drag-and-drop visual query builder, understand star schemas, and figure out why your filter isn't working."
The result: business decisions made on intuition instead of data, not because the data doesn't exist, but because the distance between the question and the answer is too wide.
3. Lost Context: The Amnesia Problem
Here's something that should terrify every data leader: your data catalog knows about table schemas but not about which dashboards use them. Your BI tool knows about dashboard usage but not about the data quality of its sources. Your ML platform knows about model performance but not about the business metrics the model affects.
Context is continuously destroyed at every tool boundary.
What does this mean in practice? Impact analysis is manual. ("If I rename this column, what breaks?" — nobody knows without a week of archaeology.) Root cause analysis is slow. ("The dashboard shows wrong numbers" — good luck tracing that backward through four different tools.) Optimization is local, never global. (The query engine doesn't know that a query runs 1,000 times per day from a dashboard and should be materialized.)
4. Governance Fragmentation: Security Theater
Access control in Tool A. Data lineage in Tool B (maybe, if someone configured it). Quality monitoring in Tool C (or a cron job someone wrote three years ago). Compliance tagging in a spreadsheet.
This isn't data governance. It's data governance theater. And the first time an auditor asks "who accessed what data, when, and why?" across your entire stack, the answer is a painful, manual, multi-week excavation project.
5. Infrastructure Complexity: The Ops Tax
Running a modern data platform means operating databases, message brokers, compute clusters, ML training infrastructure, visualization servers, monitoring systems — each with its own scaling characteristics, failure modes, and operational runbooks.
For most organizations, this operational burden is the invisible anchor dragging down their data initiatives. Your platform engineers aren't building features. They're keeping the lights on.
What If the Platform Spoke Your Language?
Now imagine a different Tuesday morning. Sarah opens a chat window and types:
"Show me which product categories had the highest stockout rate
 last quarter, broken down by region."
In under ten seconds, she sees a stacked bar chart with regional facets, a natural language summary highlighting that the "Electronics" category in the Southeast region had a 23% stockout rate (up 8% from the previous quarter), and three suggested follow-up questions.
She asks a follow-up:
"Which regions had the steepest increase compared to last year?"The system remembers the context. It doesn't ask her to re-specify "product categories" or "stockout rate." It modifies the previous analysis, executes it, and streams back an updated visualization in seconds.
This is Intent to Insights — the core paradigm behind the Matih platform.
Intent: A user expresses what they want to know, in their own words. Insights: The platform transforms that intent into validated, contextualized, visualized answers.
No tickets. No queues. No SQL. No waiting. The platform handles the entire chain: understanding the question, finding the right data, writing the query, executing it, analyzing the results, and presenting them — all through a conversational interface.
How Intent Becomes Insight (Without the Plumbing)
Behind that ten-second response, a coordinated ballet of specialized AI agents works together:
The Router classifies the intent — is this an analytical query, a documentation question, a request to build something? It reads the user's words and decides the fastest path to an answer.
The SQL Agent takes the natural language question and translates it into a precise, optimized query. But it doesn't do this blindly. It consults the data catalog — a living registry of every table, column, relationship, and business definition in the organization. It knows that "stockout rate" maps to a specific calculation, that "last quarter" means Q4 2025, and that the regional dimension table joins on region_id.
The Query Engine executes the query across whatever data sources are relevant — a data warehouse here, a data lake there, an operational database elsewhere — federating the query seamlessly.
The Analysis Agent looks at the results and identifies what's interesting. It spots the trend, the outlier, the statistically significant change.
The Visualization Agent picks the right chart type (not a pie chart for time series, thank you) and renders it.
And all of this streams back to the user in real-time via WebSocket, so they see progressive results rather than staring at a loading spinner.
The Catalog: The Unsung Hero
Here's what makes this work — and what most "AI-powered analytics" tools get wrong: the data catalog is not optional decoration. It's the foundation.
Without a comprehensive catalog of metadata — what tables exist, what columns mean, how they relate to each other, what business terms map to what technical fields — the AI is just guessing. And AI that guesses with your business data is worse than no AI at all.
Matih maintains a living catalog that automatically discovers schemas, tracks lineage (where data came from, how it was transformed, where it goes), monitors quality scores, and maps business terminology to technical reality. When the AI generates SQL, it's not hallucinating table names. It's working from a verified, up-to-date map of your data landscape.
This is also why data quality scores travel with every answer. When Sarah sees her stockout analysis, she also sees a confidence indicator. If the source data hasn't been refreshed in three days, she knows. If a column has null rate anomalies, she's told. Trust isn't assumed — it's earned, per query.
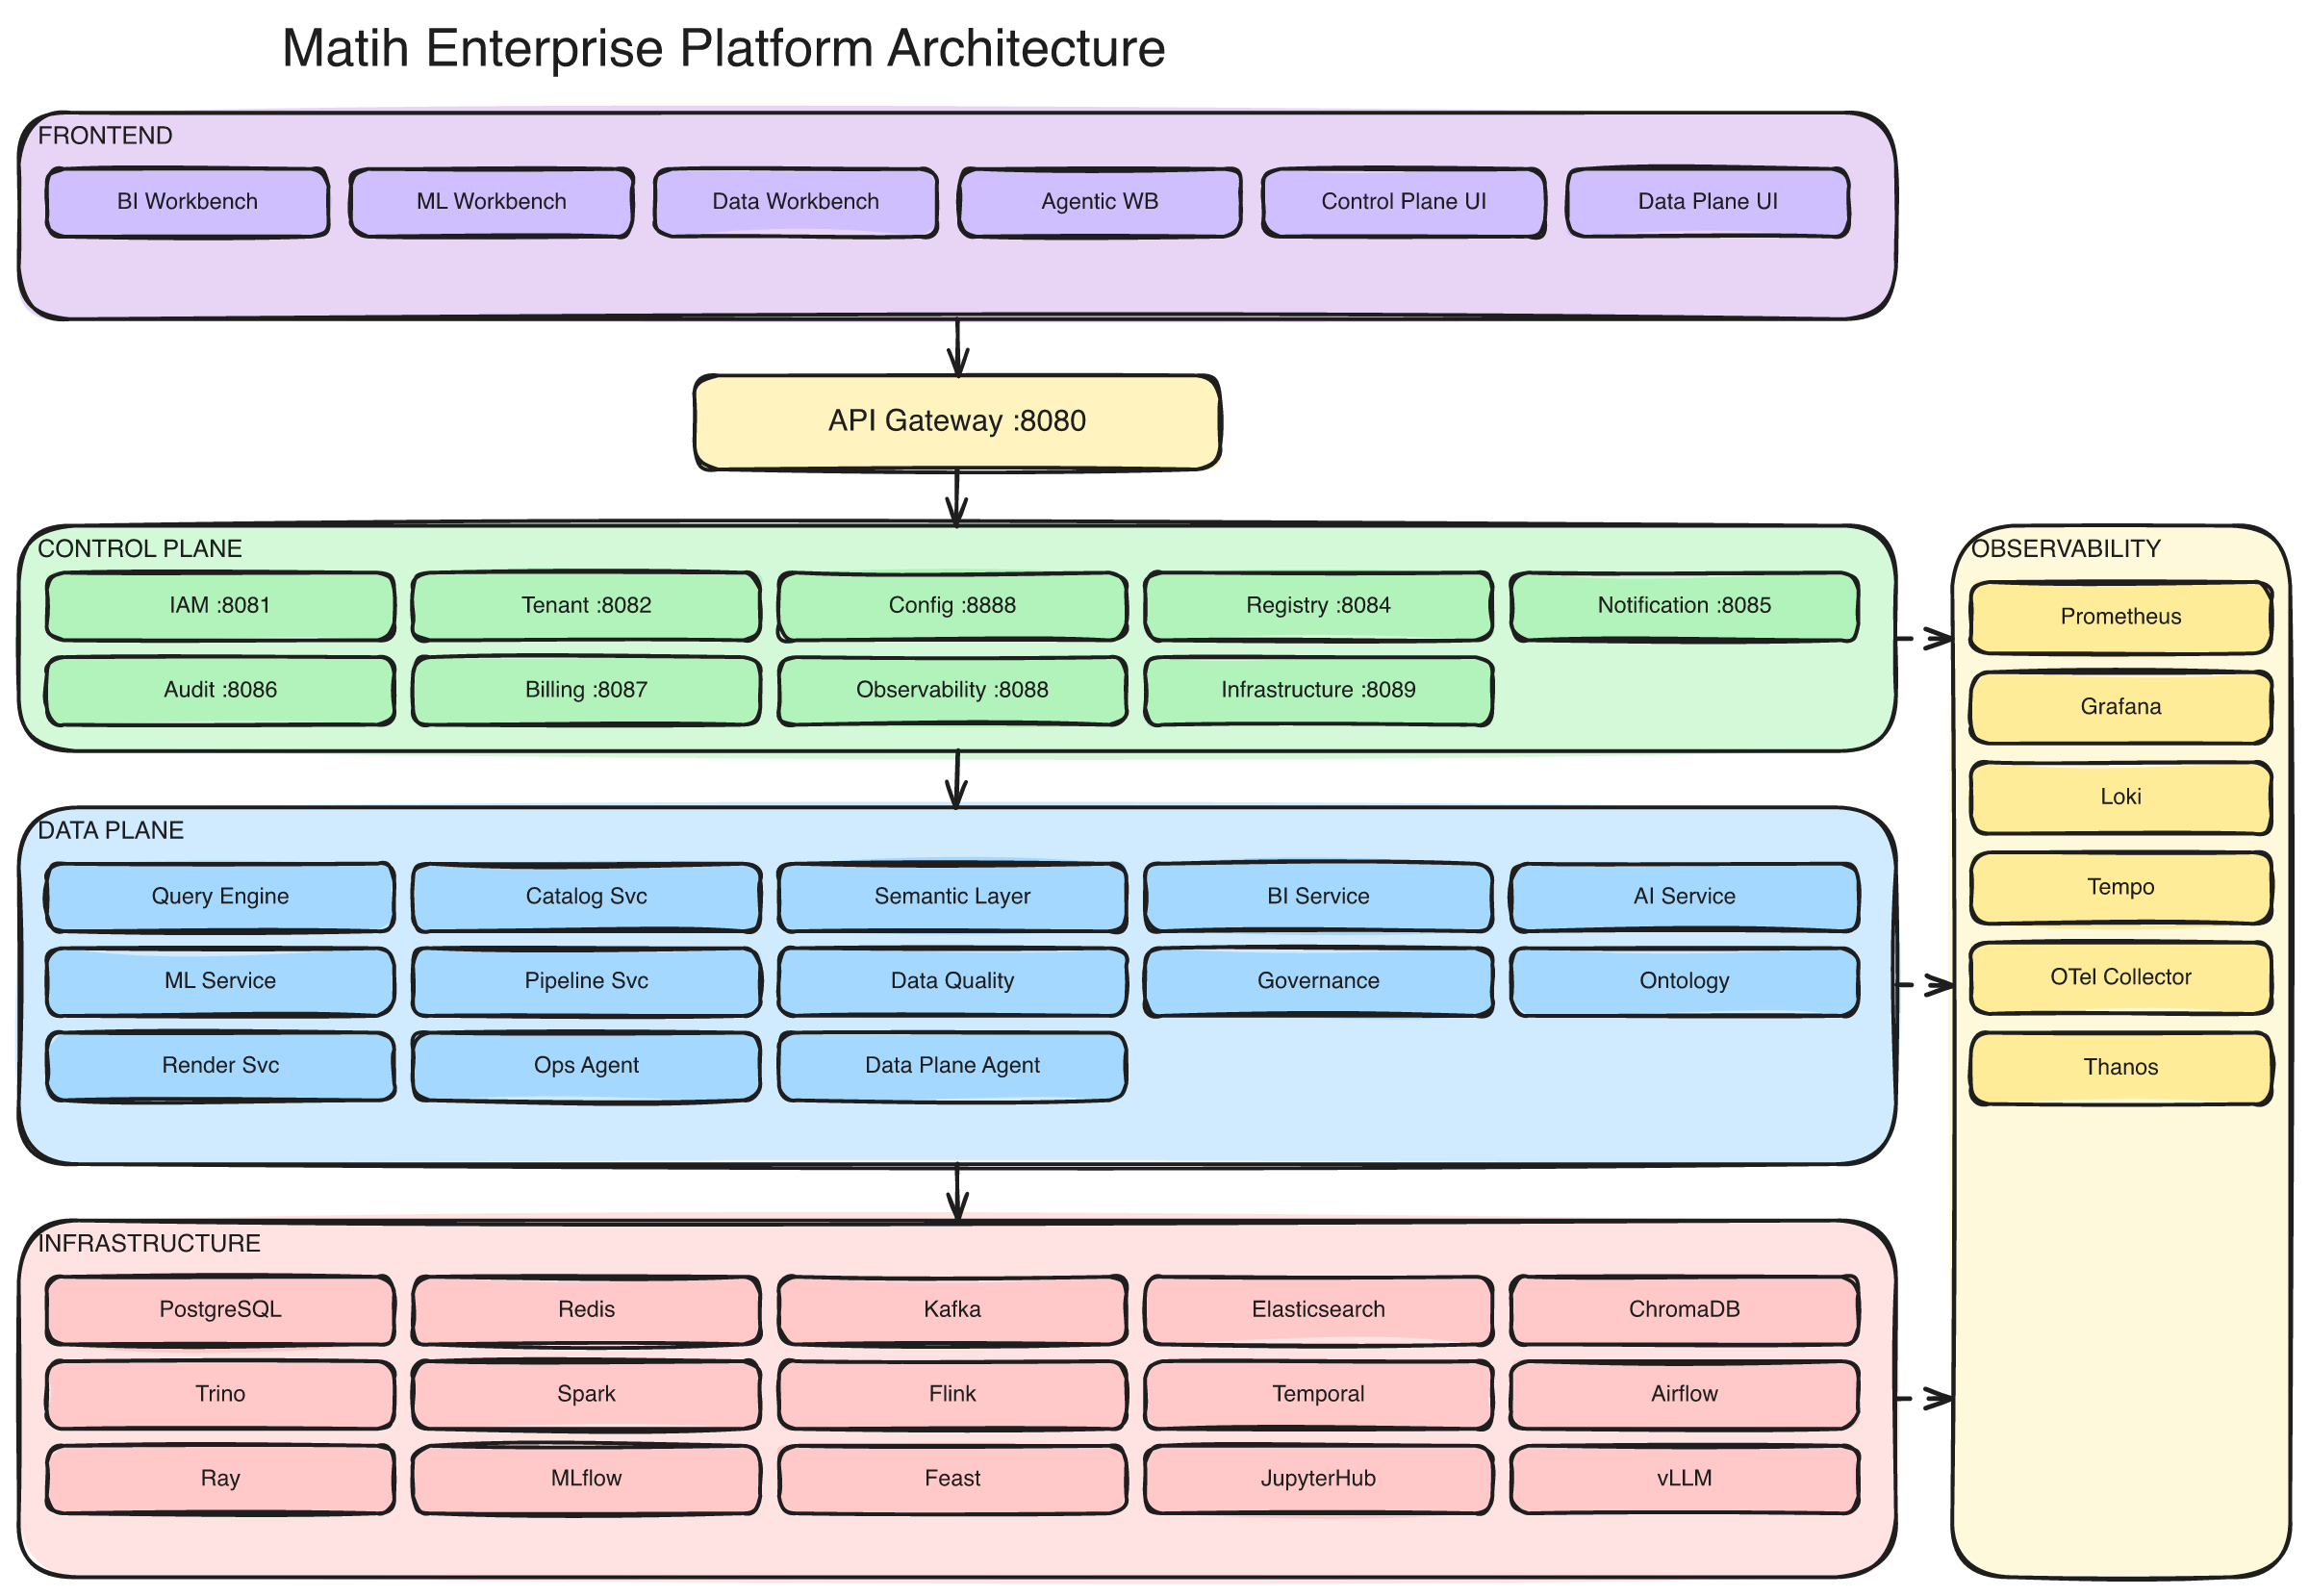
The full Matih platform: 8 frontend workbenches, 10 control plane services, 14 data plane services, and a distributed data/ML/AI infrastructure layer — all unified under a single API gateway.
The Context Graph: Organizational Memory
Remember the third problem — lost context? Matih solves it with something called the Context Graph: a knowledge graph that maintains relationships between everything in the platform.
Every query, every dashboard, every table, every pipeline, every user, every ML model — they're all nodes in a graph. And the connections between them are preserved:
- This dashboard uses these queries which read from these tables which are populated by this pipeline.
- This user frequently asks about this topic and tends to follow up with these patterns.
- This table has a quality score of 94%, is used by 12 dashboards, and was last refreshed 2 hours ago.
The Context Graph is what turns Matih from a tool into an institutional memory. It knows things that no individual person in the organization knows — because it sees the connections across every boundary.
Impact analysis? Instant. ("If you rename this column, these 7 dashboards and 3 ML models will break.") Recommendations? Intelligent. ("Users who analyzed customer churn also looked at these dimensions.") Optimization? Automatic. ("This query runs 500 times per day. Here's a materialized view that would make it 100x faster.")
Developer Experience: Because Engineers Are Users Too
Here's something the enterprise software world often forgets: the developer experience matters as much as the business user experience. If your platform engineers and data engineers hate working with the platform, adoption dies regardless of how pretty the dashboards are.
Matih is built on open standards that engineers already know and trust:
- Standard SQL via Trino — not a proprietary dialect
- Apache Spark, Flink, and Ray for heavy compute — the same frameworks engineers use everywhere else
- MLflow for experiment tracking — because nobody wants to learn yet another model registry
- Helm and Terraform for infrastructure — the tools every platform engineer already has in their toolkit
- OpenAPI specs for every service — so integrating with Matih is the same as integrating with any well-documented API
- SDKs in Python, TypeScript, and Java — because "API-first" means nothing without client libraries
Pipeline templates for 10+ industry verticals mean engineers aren't starting from scratch. Pre-built patterns for incremental loads, CDC pipelines, SCD Type 2 transformations, and data quality gates mean less boilerplate and more building.
And critically, everything is self-hosted on Kubernetes — your infrastructure, your cloud, your rules. No vendor lock-in. No "works on our cloud but not yours." If it runs Kubernetes, it runs Matih.
The Numbers That Matter
Let's talk about what this actually costs.
The typical enterprise data stack:
| Category | Annual Cost |
|---|---|
| Tool licenses (8-12 tools) | $225,000 |
| Cloud compute | $120,000 |
| Integration engineering (1-2 FTEs) | $200,000 |
| Operational maintenance (1 FTE + on-call) | $150,000 |
| Security/compliance audits (cross-tool) | $75,000 |
| Training and onboarding | $50,000 |
| Incident response (cross-tool debugging) | $80,000 |
| Total | ~$900,000/year |
The Matih alternative:
| Category | Annual Cost |
|---|---|
| Infrastructure (Kubernetes) | $120,000 |
| Platform operations (0.5 FTE) | $75,000 |
| Per-tool licenses | $0 |
| Integration cost | $25,000 |
| Training (one platform) | $15,000 |
| Total | ~$235,000/year |
That's a 74% reduction — and the structural advantage (eliminating integration tax, reducing operational surface area) only grows as the organization scales.
But honestly, the cost savings aren't even the main point. The main point is time-to-insight. Sarah's question goes from seven days to ten seconds. Multiply that across every business user in the organization, every day, and you start to see the compounding effect.
What Matih Is (and What It Isn't)
Let's be precise.
Matih IS:
- A unified platform where data engineering, ML, AI, and BI coexist in one system
- A conversational interface that makes the entire data stack accessible through natural language
- Cloud-agnostic and self-hosted — runs on any Kubernetes cluster (AWS, Azure, GCP, bare metal)
- Multi-tenant by design — built for organizations that need isolation between business units or customers
- Built on open standards (SQL, OpenTelemetry, Helm, Terraform, Apache Iceberg) — no lock-in
Matih IS NOT:
- A replacement for your data warehouse storage (it queries your existing storage via Trino)
- A general-purpose LLM hosting platform (it uses LLM providers like OpenAI, Anthropic, or self-hosted vLLM)
- A spreadsheet replacement
- Yet another BI tool with a chatbot bolted on as an afterthought
The conversational AI layer is the primary interface, not a feature checkbox. Every capability in the platform — from pipeline creation to model deployment — is designed to be accessible through conversation first, workbench UI second.
The Road From Here
This is the first post in an eight-part series exploring the Matih platform. Coming up:
- Blog 2: The Architecture of Understanding — How Matih's two-plane architecture separates concerns without sacrificing integration
- Blog 3: Your Data Has Meaning — Ontologies, semantic queries, and why "dumb SQL" is leaving money on the table
- Blog 4: The Context Graph — Your organization's memory that never forgets
- Blog 5: Forward Deployed AI Agents — The engineers that never sleep
- Blog 6: From Bytes to Brilliance — Data processing at planetary scale
- Blog 7: Enterprise-Grade Without Enterprise Pain — Security, governance, and trust
- Blog 8: Building with Claude Code — 34 microservices, one AI pair programmer, and what we learned
The Bottom Line
Every organization deserves a data platform that speaks their language. Not SQL. Not DAG configurations. Not YAML manifests. Their language — the language of business questions, curiosity, and decisions.
The distance between a question and an answer should be measured in seconds, not sprints.
That's the bet Matih is making. And it starts with three words: Intent to Insights.
About Matih: Matih is a cloud-agnostic, Kubernetes-native platform that unifies Data Engineering, Machine Learning, Artificial Intelligence, and Business Intelligence into a single system with a conversational interface at its core. Learn more at matih.ai (opens in a new tab).
Tags: #DataPlatform #AI #ConversationalAnalytics #DataEngineering #IntentToInsights #Enterprise #ModernDataStack
Next in the series: The Architecture of Understanding: Two Planes, One Platform, Zero Compromises