The Context Graph: Your Organization's Memory That Never Forgets
"The greatest value of a picture is when it forces us to notice what we never expected to see." — John Tukey
Reading time: 14 minutes Series: The Matih Platform Blog Series (4 of 8) — Semantic Intelligence, Part 2 Audience: Data Scientists, AI Engineers, Platform Architects, Anyone who's ever asked "what broke, and why?"
The Question Nobody Can Answer
It's 2:47 PM on a Thursday. The fraud detection model just started returning anomalous scores — flagging 40% of legitimate transactions as suspicious. Customer support tickets are spiking. The VP of Payments wants answers. Now.
The ML engineer opens the model registry. The model was retrained three days ago. Looks normal. She checks the feature store. Feature drift looks okay. She checks the upstream pipeline. The pipeline ran successfully this morning.
Forty-five minutes in, she finds it. A data engineer renamed a column in the source table last week — transaction_amount became txn_amount. The staging pipeline handled it gracefully with a column alias. But the feature pipeline, maintained by a different team, still referenced the old name. It didn't fail — it silently fell back to a default value of zero. The model retrained on corrupted features. And nobody knew until customers started complaining.
The actual root cause was a one-line schema change. The investigation took 45 minutes. In a platform without memory, it would have taken days.
This is the problem the Context Graph solves. Not just "what happened" but "why it happened," "what else it affected," and "have we seen this pattern before?"
What Is the Context Graph?
Think about what you know versus what your organization knows.
You know which dashboards you use. Your colleague knows which pipelines feed those dashboards. Another team knows which models consume those pipeline outputs. A data engineer who left six months ago knew which upstream tables are fragile.
All of that knowledge — scattered across people's heads, Slack threads, and tribal memory — disappears every time someone changes roles, goes on vacation, or leaves the company.
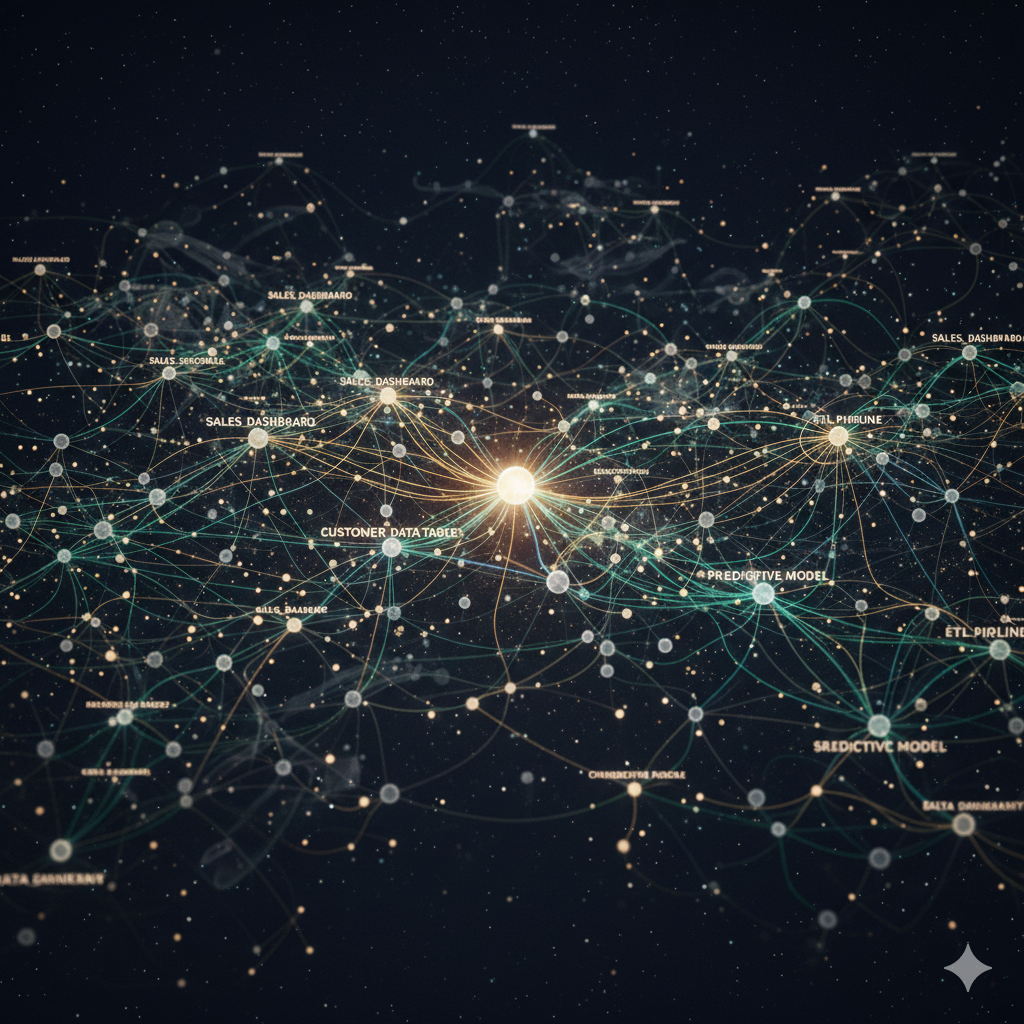
The Context Graph is Matih's answer to organizational amnesia. It's a knowledge graph that captures entities, relationships, actions, and patterns across every layer of your data platform — and makes that knowledge queryable, traceable, and actionable.
Every dataset, pipeline, model, dashboard, query, user, and decision becomes a node. Every connection between them — lineage, causation, similarity, dependency, ownership — becomes an edge. And every interaction is timestamped with dual time dimensions: when it happened in the real world, and when the system recorded it.
The result: a living, growing organizational memory that no individual could maintain, and no amount of documentation could replace.
Three Layers of Intelligence
The Context Graph isn't a single flat graph. It's three interconnected layers, each capturing a different dimension of organizational knowledge:
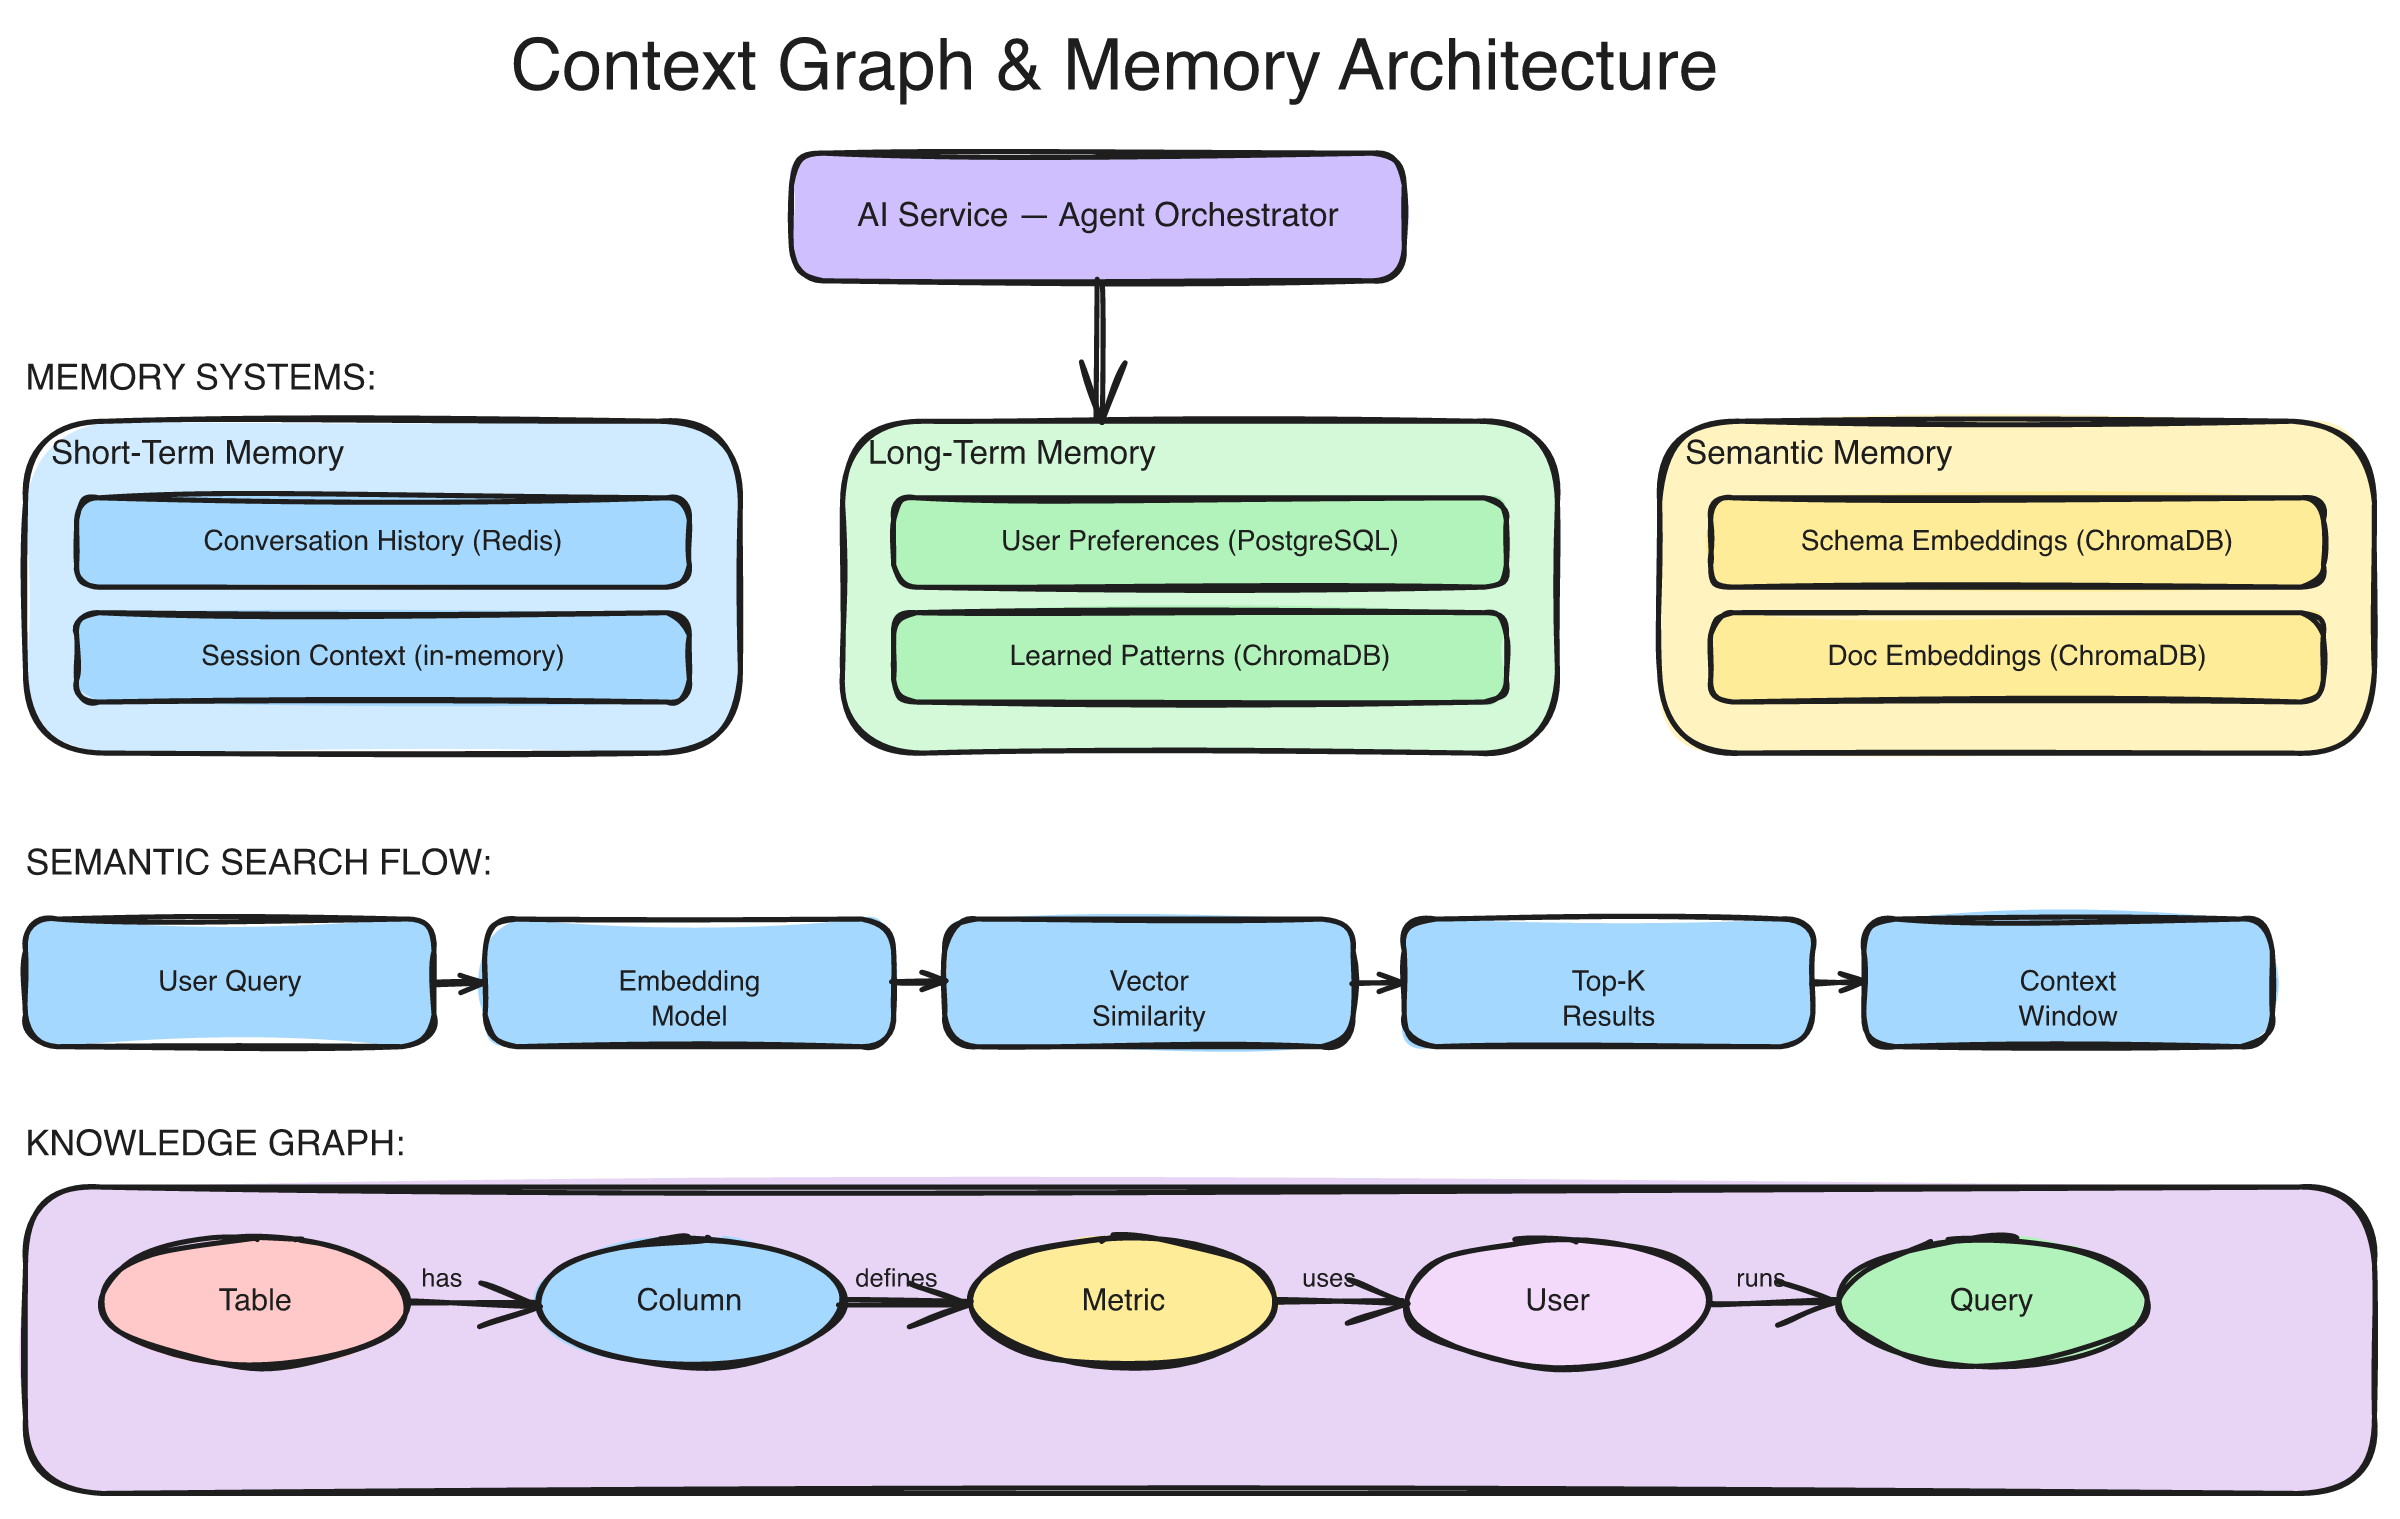
The Context Graph's three-layer architecture: the Knowledge Graph (Neo4j) captures entities and relationships, the Personal Graph tracks individual behavior and action sequences, and the Process Graph discovers recurring workflow patterns — all connected through a hybrid search layer combining graph traversal with vector embeddings.
Layer 1: The Knowledge Graph — What Exists and How It Connects
The foundation layer stores entities and their relationships in a graph database. This is the structural backbone — the "who, what, and how" of your data ecosystem.
Entities include everything in the platform: datasets, tables, pipelines, ML models, features, dashboards, users, teams, decisions, incidents, deployments, and configurations. Each entity has a universal identifier (URN), metadata, and timestamps.
Relationships — 24 types across seven categories — capture how entities connect:
| Category | Relationships | Example |
|---|---|---|
| Lineage | DERIVED_FROM, TRAINED_ON, PRODUCED_BY | "Model v2.3 was TRAINED_ON features from customer_360 dataset" |
| Causal | CAUSED, TRIGGERED, LED_TO, MITIGATED_BY | "Schema change CAUSED feature drift which TRIGGERED model degradation" |
| Dependency | DEPENDS_ON, USES_FEATURE, REQUIRES | "Fraud dashboard DEPENDS_ON fraud_score model" |
| Governance | OWNED_BY, MANAGED_BY, APPROVED_BY | "Customer pipeline OWNED_BY data-eng-team, APPROVED_BY compliance" |
| Similarity | SIMILAR_TO, PRECEDENT_FOR, VARIANT_OF | "This incident is PRECEDENT_FOR the current anomaly" |
| Temporal | PRECEDED_BY, FOLLOWED_BY, CONCURRENT_WITH | "Pipeline failure PRECEDED_BY config change" |
| Action | PERFORMED, ACTED_ON, NEXT_LIKELY | "Analyst PERFORMED query which ACTED_ON customer table" |
This layer answers questions like: "What feeds this dashboard?" "Who owns this pipeline?" "What downstream systems break if I change this table?"
Layer 2: The Personal Graph — What People (and Agents) Actually Do
The second layer tracks actions and behavior patterns — not to surveil, but to learn.
Every meaningful interaction becomes a node: views, queries, modifications, approvals, escalations. These actions are linked to the entities they touch and the actors who performed them. Crucially, this layer is privacy-preserving by design — content is stored as cryptographic hashes, not raw values. Actor identities can be anonymized for aggregate analysis.
Actions are grouped into traces — execution sessions that capture complete workflows: a user's analysis session, an AI agent's reasoning chain, a pipeline run, an approval flow. Each trace records the sequence of actions, the outcome, and a quality score.
Over time, the Personal Graph learns action transitions — probabilistic models of what typically happens next. If users who query the customer churn table usually follow up with a cohort analysis, the system learns that pattern and can suggest it proactively.
Layer 3: The Process Graph — Patterns Hidden in Plain Sight
The third layer is where individual actions become organizational intelligence.
The Process Graph uses sequential pattern mining to discover recurring workflows across all users and agents. It identifies:
- Common workflows — "When investigating a data quality alert, analysts typically check the source table quality score, then trace the lineage upstream, then check recent pipeline runs, then file a remediation ticket."
- Success patterns — Which investigation paths lead to resolution most quickly?
- Anomalies — When someone deviates significantly from an established pattern, is it innovation or a mistake?
This layer computes transition matrices, occurrence counts, success rates, and confidence scores for every discovered pattern. It turns implicit organizational knowledge — "this is how we usually investigate things" — into explicit, queryable process intelligence.
GraphRAG: Graph-Powered AI Context
Here's where the Context Graph fundamentally changes how AI works with your data.
Traditional RAG (Retrieval-Augmented Generation) retrieves relevant documents or schemas based on text similarity. It works, but it has a fundamental blind spot: it doesn't understand relationships. If you ask "What caused the revenue drop last quarter?", text-similarity RAG might find documents about revenue and documents about incidents — but it won't connect them causally.
Matih's GraphRAG combines graph traversal with vector embeddings to give the AI rich, relationship-aware context. It supports multiple retrieval strategies:
Local Search — Vector similarity to find relevant entities, then graph traversal to expand to neighboring nodes. "Find entities like this, and show me what they're connected to."
Graph-First Search — Start from a known entity, traverse the graph along specific relationship types, then rank results by vector similarity. "Starting from this model, follow the lineage upstream and find the most relevant source datasets."
Drift Analysis — Follow temporal trajectories and decision patterns to understand how things changed over time. "How has this pipeline's behavior evolved over the last quarter?"
Impact Analysis — Traverse dependency and lineage relationships to find everything affected by a change. "If I modify this table schema, what breaks?"
Decision Precedent Search — Find similar past decisions and their outcomes. "Have we seen this kind of model degradation before? What did we do?"
The result: when the AI answers your question, it draws not just on schema metadata and semantic definitions (from the ontology and semantic layer), but on the full web of relationships, precedents, and patterns that define your organization's data reality.
Temporal Memory: Time Travel for Your Data
Most systems know what's true now. The Context Graph knows what was true then.
It implements bi-temporal data modeling — tracking two independent time dimensions for every fact:
- Valid time — When was this fact true in the real world?
- Transaction time — When did the system record this fact?
This dual-time approach enables powerful queries that no single-time system can answer:
Point-in-time queries: "What was the state of the feature pipeline on January 15th at 2:30 PM?" — reconstruct the exact state when a decision was made.
As-of queries: "What did we know about model performance on January 15th?" — understand what information was available to the decision-maker at the time.
Decision replay: "Replay the model promotion decision with the context that existed at the time." — not with hindsight, but with the actual information available when the decision was made.
This matters enormously for root cause analysis. When something goes wrong, you don't just need to know what happened — you need to know what the system believed at the time. A model that looked healthy on Monday might have been trained on data that was already degraded — but the quality score hadn't updated yet. Bi-temporal queries reveal exactly these gaps between reality and recorded reality.
Causal Analysis: From "What" to "Why"
Remember the fraud model incident from the opening? In a traditional platform, tracing that root cause was archaeological work. In the Context Graph, it's a query.
The Causal Chain Analyzer traverses causal relationships with multi-factor scoring:
Incident:  "Fraud model accuracy dropped 35%"

Causal Chain (auto-discovered):
  1. Schema change on source table (txn_amount renamed)
     → Confidence: 0.92
  2. Feature pipeline silently fell back to default values
     → Confidence: 0.88
  3. Model retrained on corrupted features
     → Confidence: 0.94
  4. Anomalous scores in production
     → Confidence: 0.96

Root Cause: Schema change (entity: raw_transactions table)
Contributing Factor: Missing column validation in feature pipeline
Time to Discovery: Seconds (vs. 45 minutes manual)
Similar Precedents: 2 (Oct 2025 — pricing model; Aug 2025 — churn model)
Causal scoring weighs multiple factors: evidence strength (30%), temporal proximity (25%), structural patterns in the graph (20%), historical pattern matches (15%), and semantic similarity (10%). This isn't simple rule-matching — it's multi-dimensional reasoning over the full relationship graph.
The system can traverse causal chains up to 10 hops deep, distinguish between direct causes (CAUSED, TRIGGERED), indirect causes (LED_TO, CONTRIBUTED_TO), and mitigations (MITIGATED_BY, PREVENTED_BY), and surface similar historical patterns as precedents.
Agent Thinking: Capturing How AI Reasons
Here's something unique: the Context Graph doesn't just track what the AI does. It captures how the AI thinks.
Every AI agent interaction is recorded as a thinking trace — a step-by-step record of the agent's reasoning process:
- Intent Analysis — How the agent interpreted the user's question
- Context Retrieval — What context it gathered and from where
- Tool Selection — Which tools it chose and why
- Query Planning — How it structured the SQL or analysis
- Confidence Assessment — How confident it was in each step
- Error Reasoning — How it handled unexpected results
- Response Synthesis — How it assembled the final answer
Each step includes the reasoning text, confidence score, alternatives considered, and resources consumed. These traces are embedded as vectors for similarity search — so the system can find "past interactions where the AI solved a similar problem" and learn from them.
This creates a feedback loop: agents learn from past interactions, patterns emerge from aggregate behavior, and the next question gets answered with the benefit of every previous answer.
Impact Analysis in Seconds, Not Weeks
One of the most common and most dreaded questions in data engineering: "If I change this, what breaks?"
Without a Context Graph, answering this requires manual archaeology — checking dashboards, searching for downstream consumers in pipeline configs, asking around on Slack, and hoping you found everything.
With the Context Graph, it's a graph traversal:
Query: "Impact of renaming column 'revenue' in sales.orders"

Downstream Impact (auto-traced):
  ├── 3 Semantic Layer metrics (total_revenue, avg_order_value, revenue_growth)
  ├── 7 Dashboards (Executive Summary, Regional KPIs, Sales Forecast, ...)
  ├── 2 ML Models (revenue_predictor_v3, churn_correlation_model)
  ├── 4 Pipelines (daily_revenue_agg, weekly_report_gen, ...)
  ├── 12 Scheduled Queries (via BI service)
  └── 1 External Integration (Salesforce revenue sync)

Risk Assessment: HIGH — affects executive dashboards and ML models
Recommended: Staged migration with column alias during transition
Similar Past Changes: 3 (all completed successfully with alias pattern)
This isn't hypothetical. The lineage, dependency, and consumption relationships already exist in the graph — tracked automatically as entities interact with each other. Impact analysis is reading the graph, not building it.
Privacy by Design
Organizational memory raises legitimate privacy concerns. The Context Graph addresses them structurally:
- Content hashing — Raw content (query text, data values) is stored as SHA-256 hashes, not plaintext. The graph knows what type of action occurred without storing sensitive content.
- Actor anonymization — For aggregate analytics, actor identities are hashed. Pattern mining works on anonymized data.
- Visibility levels — Four progressively detailed access tiers (summary, standard, detailed, full), each gated by specific permissions. A team lead sees action summaries; a platform admin sees full reasoning traces.
- Tenant isolation — Every node, edge, and query in the graph is scoped to a tenant. Cross-tenant data access is structurally impossible.
- Bi-temporal audit — The graph itself is its own audit trail. Every change is timestamped and immutable — you can always answer "who knew what, when."
How It All Connects
The Context Graph is the third pillar of Matih's intelligence stack — and it changes the nature of what the other pillars can do:
Catalog + Context Graph = Impact analysis. The catalog knows what data exists; the Context Graph knows what uses it. Together, they answer "if this table changes, what breaks?" in seconds.
Ontology + Context Graph = Semantic root cause analysis. The ontology knows what business concepts mean; the Context Graph knows what caused what. Together, they trace "revenue dropped" from a business metric through semantic definitions to the physical data change that caused it.
Semantic Layer + Context Graph = Intelligent suggestions. The semantic layer knows how to measure things; the Context Graph knows what people typically measure after what. Together, they don't just answer your question — they suggest the next one.
AI Service + Context Graph = Learning AI. The AI service generates queries and analyses; the Context Graph remembers what worked, what failed, and what the user did next. Together, they get smarter with every interaction.
"In God we trust; all others must bring data." — W. Edwards Deming
The Context Graph ensures that the data about how your organization uses data is itself captured, connected, and made actionable. It turns the platform from a tool you use into an institution that learns.
What This Means for Your Organization
If you're a data scientist, this means your models have provenance. You can trace any prediction back through the feature pipeline, training data, and model decisions that produced it — with timestamps for every step.
If you're an ML engineer, this means debugging is graph traversal, not archaeology. When a model degrades, the causal chain tells you why before you finish your first coffee.
If you're a data engineer, this means impact analysis is instant. Change a table, and the graph tells you what downstream consumers need to be updated — before you push to production.
If you're a platform architect, this means you have organizational intelligence that survives personnel changes, team restructures, and tool migrations.
Coming Up Next
This post and Blog 3 formed the "Semantic Intelligence" series — covering ontologies, the semantic layer, and the Context Graph. Next, we move from understanding data to acting on it with AI agents that work alongside your team.
- Blog 5: Forward Deployed AI Agents: The Engineers That Never Sleep — Specialized AI agents, agent orchestration, the marketplace, and how AI moves from chatbot to colleague
About Matih: Matih is a cloud-agnostic, Kubernetes-native platform that unifies Data Engineering, Machine Learning, Artificial Intelligence, and Business Intelligence into a single system with a conversational interface at its core. Learn more at matih.ai (opens in a new tab).
Tags: #ContextGraph #KnowledgeGraph #GraphRAG #DataLineage #CausalAnalysis #AI #DataEngineering #OrganizationalMemory
Previous: Your Data Has Meaning: Ontologies, Semantic Queries, and the Death of Dumb SQL Next: Forward Deployed AI Agents: The Engineers That Never Sleep